
.webp)
We pulled occupancy pacing and pricing data across all 16 FIFA World Cup 2026 host markets. No two cities are telling the same story, and some of what we found will change how you price.
We pulled occupancy pacing across all 16 FIFA World Cup 2026 host markets and layered in pricing data. No two cities are telling the same story, and some of what we found is genuinely surprising.
16 markets analysed · US · Canada · Mexico · Data as of 6 May 2026 · Updated every 24 hours

The FIFA World Cup 2026 kicks off on June 11. Sixteen host cities across the US, Canada, and Mexico, 104 matches. And right now, Beyond’s data is showing some genuinely fascinating patterns in how short-term rental demand is shaping up across the tournament window.
We pulled occupancy pacing for all 16 markets, looking at what’s on the books today for World Cup stay dates versus where those same markets sat at this exact point last year. We also looked at how pricing has moved. What came back is a picture worth sharing, because no two markets are telling the same story.
KANSAS CITY
Six matches, twenty-five days, a story in two halves.
The full Kansas City schedule runs from June 16 through July 11, covering two group stage clusters, a Round of 32, and a Quarter-Final. Reigning world champions Argentina open against Algeria on June 16 — the kind of fixture that puts a city on the global map overnight.
For the week of June 14, 33% of available nights are already on the books compared to 22% at the same point last year. The June 21 window, covering the June 25 and June 27 matches, is at 28% booked versus 24% last year. Both are solid numbers for a market that had no comparable event last Summer.
All five World Cup windows

The interesting conversation starts when you get to the knockout rounds. The week of June 28, covering the Round of 32 on July 3, is currently at 17% booked versus 19% at the same point last year, and the Quarter-Final window on July 11 is also slightly behind, with 13% on the books compared to 14% last year. Pricing for those dates is sitting well above last year’s baseline, with open-bracket knockout dates carrying significant premiums even though the matchups are not confirmed yet.
It’s worth watching how those dates develop over the next few weeks as the group stage picture becomes clearer, and fans know which teams are in contention.
ALL 16 MARKETS · GROUP STAGE
The group stage picture across all 16 cities.
Looking at the full dataset for the two group stage windows, a clear split emerges between markets converting demand strongly and those where the picture is more mixed.


HOUSTON · PHILADELPHIA
The two markets nobody’s talking about are having a strong tournament window.
Neither market gets much attention in the World Cup conversation, but the pacing data for both is compelling.
Houston has 26% of its available nights booked for the week of June 14, compared to 12% at the same point last year, and that momentum carries through into the week of July 5, where 17% of nights are on the books versus just 7% last year, covering the Round of 32 lead-in. That kind of sustained uplift across the full window, not just around specific fixtures, is one of the more consistent performances in the dataset.

Philadelphia tells a similar story, ahead of last year in every single window we measured. It shows 22% booked versus 15% in the week of June 28, and 14% versus 10% heading into the Quarter-Final week. No single marquee fixture is doing all the heavy lifting. Just steady, broad-based forward bookings across the whole calendar.
NEW YORK / NEW JERSEY
The Final city is building exactly as you’d hope.
The Final is on July 19 at MetLife Stadium, and the NY/NJ pacing data reflects exactly that. Demand is not front-loaded around group stage dates. It builds progressively across the window. The strongest reading in the dataset for that market is in the week of July 12, heading into Final week, where 27% of available nights are already booked compared to 19% at the same point last year.
Pricing in NY/NJ is notably more conservative than other US markets, roughly 1.3x last year’s baseline, and pacing is consistently positive across all five windows. The Final city playing the long game.
Fans aren’t booking New York for group stage games. They’re booking it because they want to be there when the trophy is lifted, and the demand curve reflects that, loading in gradually and building as the tournament progresses. The demand curve reflects that, loading in gradually and building as the tournament progresses.
BOSTON
Strong in June, worth watching in July.
Boston has 54% of available nights booked for the week of June 14, compared to 40% at the same point last year. That is one of the highest readings in the dataset for that window. The week of June 21 is also strong at 45% booked versus 32% last year. The picture softens as the window extends into July, with the week of June 28 essentially flat versus last year and the week of July 12 at 22% booked compared to 26% last year.
Pricing for the June windows is significant, running well above last year’s actuals for those dates. Boston is an interesting one to keep an eye on as we get closer to the tournament.
MEXICO · GUADALAJARA · MONTERREY · MEXICO CITY
The Mexican markets are showing some of the biggest year-on-year movements.
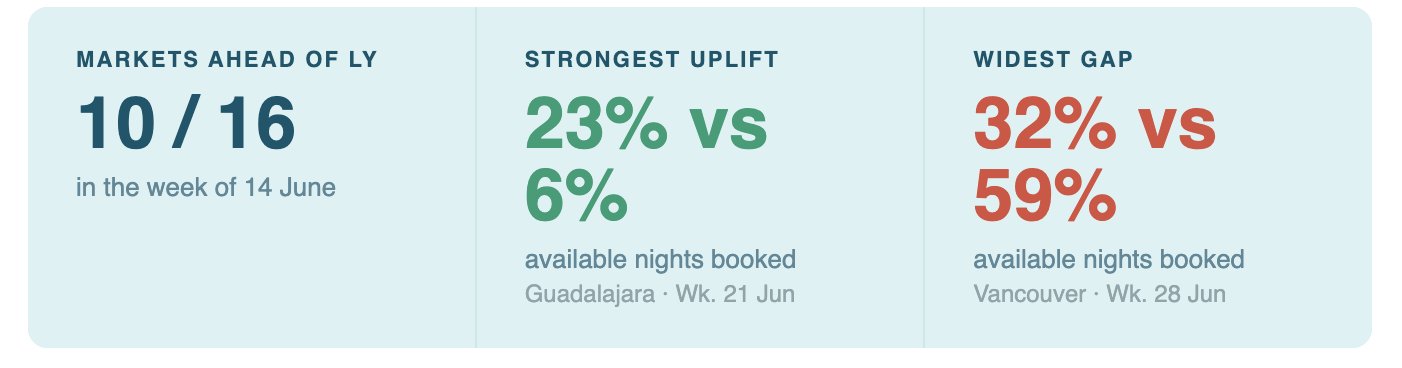
Guadalajara has 21% of available nights booked for the week of June 14 compared to 7% last year, and 23% booked in the week of June 21 versus just 6% last year. That is the highest single weekly reading in the entire dataset. Monterrey is similarly strong across both windows, with 18% booked versus 4% last year in the June 14 window and 16% versus 4% in the June 21 window.

Context matters here. Both Guadalajara and Monterrey are working off a lower prior-year base than the major US cities, which amplifies the percentage point movements. But the directional signal is clear: these are markets where World Cup demand is making a genuinely meaningful difference to forward bookings. Mexico City, which hosts the tournament’s opening match, is consistently ahead across all five windows, including positive readings right through the knockout round dates. It is one of the more complete pacing pictures in the dataset.
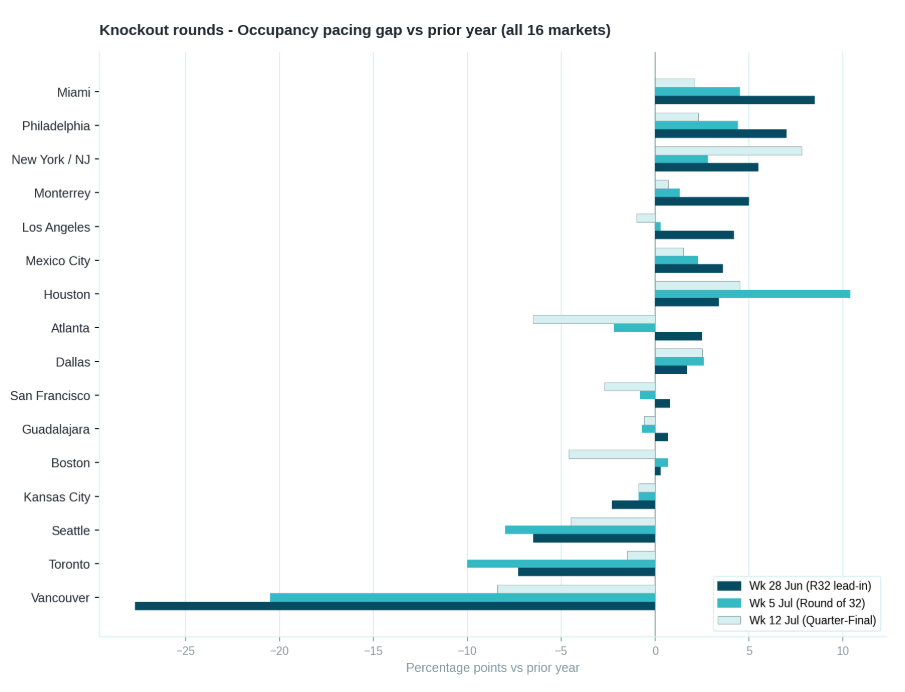
ALL 16 MARKETS · KNOCKOUT ROUNDS
The knockout round windows tell a different story.
The group stage picture is broadly positive across most markets. The knockout rounds are where the dataset gets more nuanced, with several markets that paced well in June showing softer readings as the window extends into July.
VANCOUVER · TORONTO
The Canadian markets are worth watching closely.
The pacing data for Vancouver stands out across the dataset, with 35% of available nights booked for the week of June 14 compared to 46% at the same point last year, and 39% booked in the week of June 21 versus 45% last year. The picture sharpens significantly in the week of June 28, where just 32% of nights are on the books compared to 59% at the same point last year.

Toronto similarly flips from positive in the group stage windows, with 34% booked versus 31% in the June 14 window and 32% versus 29% in June 21, to negative in the knockout rounds, where just 20% of nights are on the books compared to 30% at the same point last year in the week of July 5.
ALL 16 MARKETS · PRICING
Every market has moved pricing up. The scale varies considerably.
Every host market has moved pricing up for the World Cup window. The scale varies considerably, from relatively modest increases in markets like New York/New Jersey and Toronto, to very significant uplifts in Kansas City and Miami, where pricing is running at multiples of last year’s baseline.
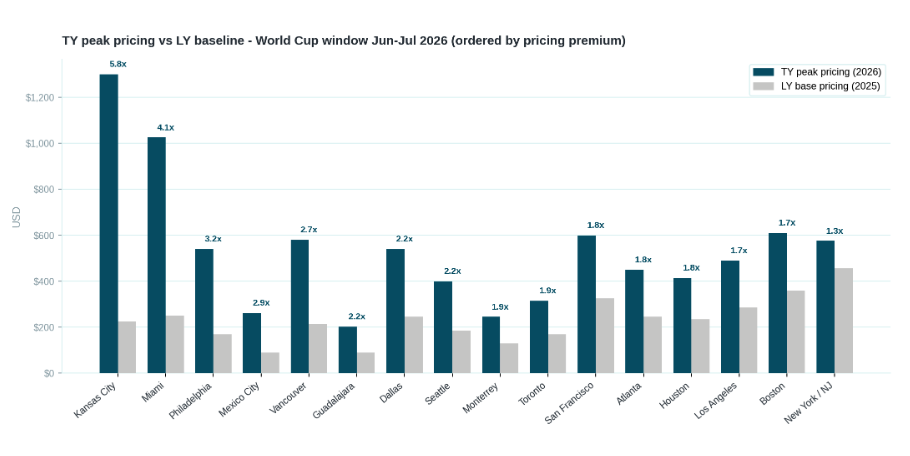
Miami is an interesting case. A significant pricing increase over last year sits alongside occupancy of 29% booked versus 17% last year in the week of June 21, and 21% booked versus 13% in the week of June 28. That combination of higher pricing and strong pacing is one of the more striking data points in the full dataset.
Note: Occupancy pacing compares what’s on the books today against the same point last year, a like-for-like view of booking momentum, not a prediction of where the market ends up. World Cup travel has genuinely different characteristics to leisure demand. Accommodation decisions are often made after ticket confirmation, which compresses the booking curve in ways that do not show up cleanly in standard pacing reads.
SO, WHAT DOES ALL OF THIS MAKE US THINK ABOUT?
A few things worth reflecting on, wherever you’re operating.
IF YOUR PACING IS STRONG ACROSS THE FULL WINDOW — Houston, Philadelphia, Mexico City
The conversation here is not about whether demand exists, because it clearly does. It’s about whether your current pricing strategy is capturing the full value of that demand, or whether you’ve left room on the table by moving pricing conservatively on the shoulder nights either side of match dates. Guests travelling for the World Cup are typically staying multiple nights, and while the match night gets most of the attention, the nights around it are worth an equally close look.
IF YOUR GROUP STAGE IS STRONG BUT JULY IS SOFTER — Boston, San Francisco, Atlanta
It’s a natural shape for markets where specific fixtures are driving demand rather than the tournament as a whole. The question worth sitting with is whether the July dates are priced in a way that reflects the uncertainty of open-bracket fixtures, or whether they’re carrying the same premium as the confirmed match dates. A fan who’ll pay a significant premium for a confirmed Argentina game may think quite differently about a Round of 32 date where the teams are not yet known.
IF YOUR PRICING AND OCCUPANCY ARE NOT MOVING TOGETHER — Kansas City, Seattle
That combination is worth examining honestly, because it does not necessarily mean pricing is wrong. World Cup booking curves are genuinely compressed, and late-booking fans waiting on ticket confirmation could change the picture quickly. But it’s worth asking whether the gap between your current pricing and what’s actually converting is working for you or against you with five weeks to go.
IF YOU’RE IN VANCOUVER OR TORONTO — The Canadian markets
Vancouver in particular is far enough behind last year’s pace that it warrants a genuine look at the full picture, not just pricing, but also how the inventory is positioned, what minimum stay requirements look like around match dates, and whether the market is being reached by the international demand that’s driving bookings elsewhere. Toronto has time because the group stage windows are still positive, but the knockout round softness is real and worth getting ahead of.
One thing that applies everywhere.
World Cup demand does not follow the same booking curve as a normal Summer weekend, and accommodation decisions are often made after ticket confirmation, which means a meaningful chunk of bookings across all 16 markets is still to come. What the pacing data shows today is a snapshot, not a final score. The markets that are ahead have built a strong foundation, and the markets that are behind still have a window to work with.
